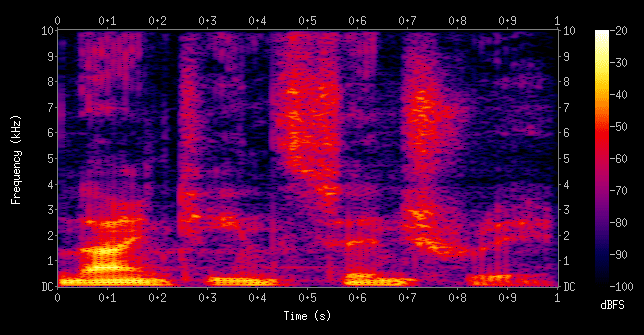
How can we see an audio ? Usually, by its waveform, but we can also see the visual representation of its frequency over time, which is a spectrogram.****
Since every audio can be represented by a visual way, can we construct an audio file from an image, that will be reproduced as its spectrogram ? Yes, we can.
For Windows, I recommend to use the software Coagula Light to do it, which has a graphic interface, so you probably won’t have problems: https://www.abc.se/~re/Coagula/Coagula.html
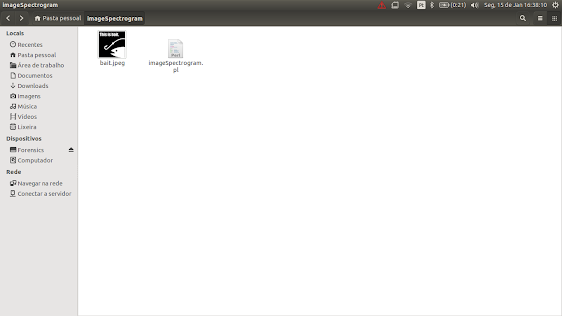
If you are using a Linux distribution, just as me, you may use a perl script called imageSpectrogram, which you can get by git clone:
git clone https://github.com/plurSKI/imageSpectrogram.git
And you will also need two Perl CPAN dependencies:
cpan Audio::Wav
cpan GD
If you have problems trying to get GD, make sure that you have libgd2-xpm-dev:
sudo apt-get install libgd2-xpm-dev
And try again.
Now you are able to generate the audio file just by running:
./imageSpectrogram file.example
To make sure that everything will run right, use black and white image with its extension in the name (.png, .jpeg…)
Check the steps in practice below:
Choose the image

Make sure you have the script
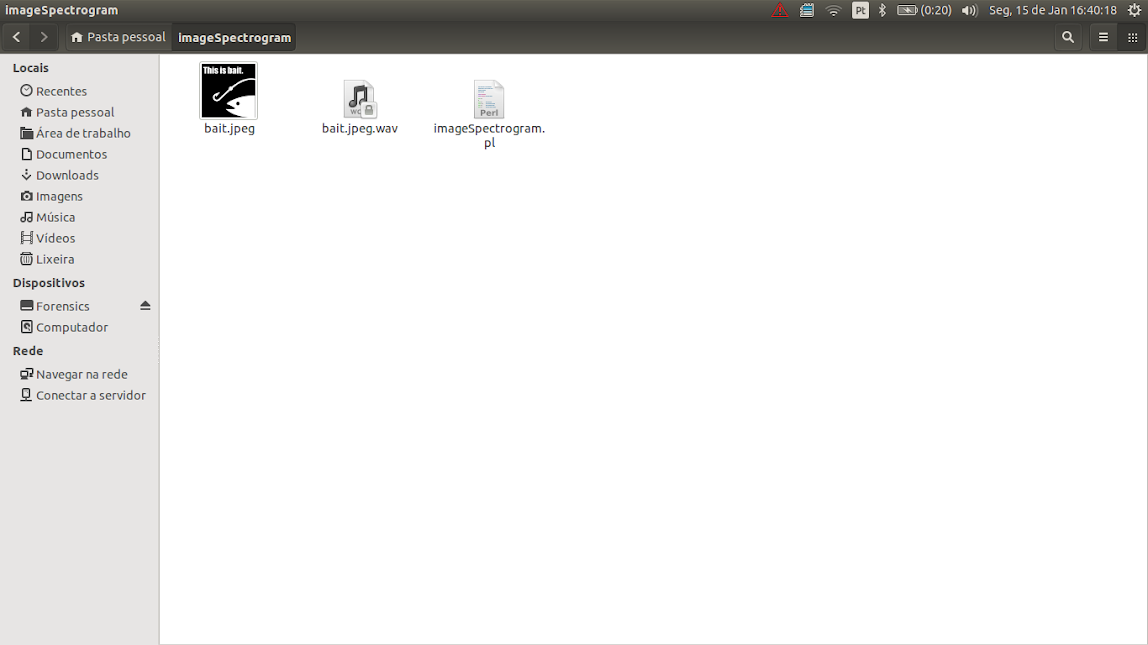
Run it and then you get the audio
./imageSpectrogram.pl bait.jpeg
As it was expected, the sound is kinda weird.
Done
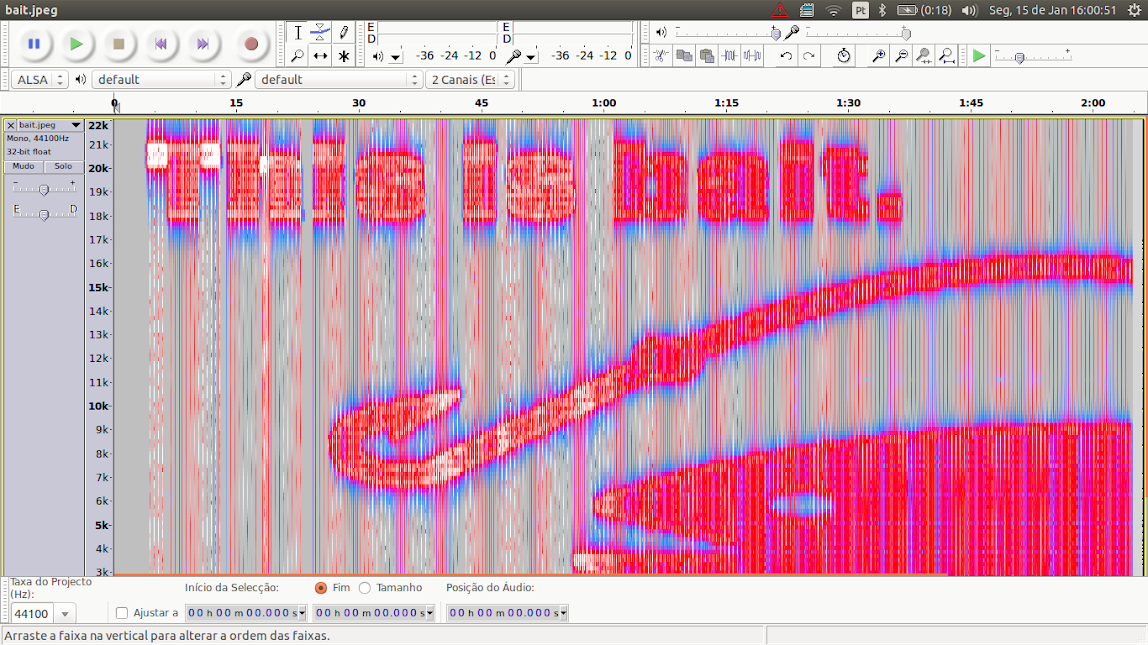
You did it, but at least, we can check it by opening it in Audacity:
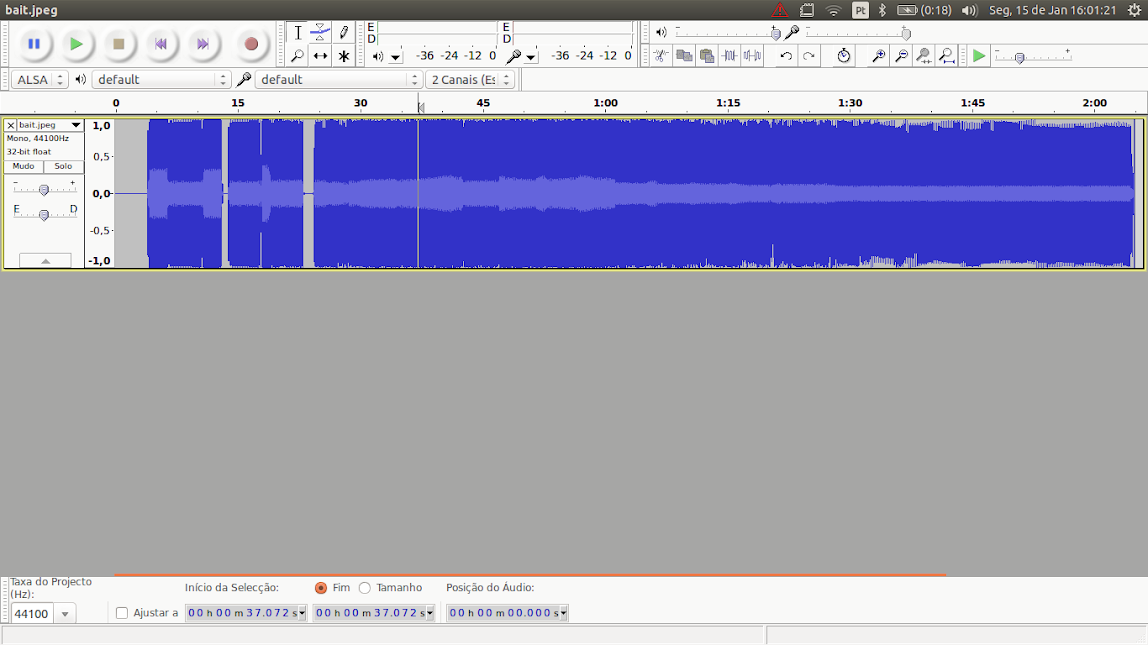
This is showing us its waveform, but if we change to spectrogram by clicking right on the bar with the file’s name, we can see:
Also, you can combine this with other methods, from now it’s all up to you.